Is localization the next great growth opportunity for subscription apps?
With some countries seeing up to 31% YoY growth, now's the time to go international.


Peter Meinertzhagen
“The app ecosystem’s nonstop growth finally slipped this past year”, reads TechCrunch’s reporting of Data.ai’s State of Mobile 2023 report.
According to the report, consumer spending dropped by 2% in 2022, with “macroeconomic factors” and a global cost of living crisis likely the cause.
On a surface level, and looking just at the macro-picture, readers might be forgiven for surmising that the golden age for entrepreneurial app creators is coming to an end. Time to find the next big opportunity.
But what the headlines don’t tell you is that the next big opportunity is right under our noses.
Localization.
In this article, I’ll be presenting some data that you won’t find in Data.ai’s report — and great thanks to Lexi Sydow, Data.ai’s Head of Insights, for sharing this — that should help steer you in the right direction when it comes to taking your app global.
Reduced gaming spend is the cause for the overall decline
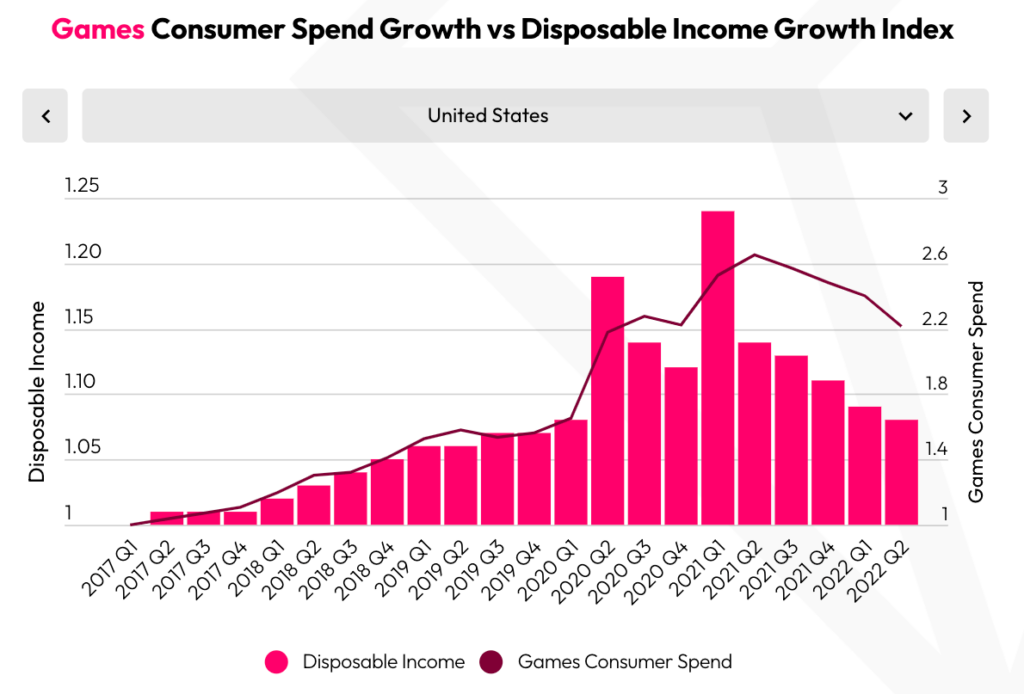
If you’ve already explored the report or listened to our podcast episode with Lexi, you’ll know that the chief cause of this overall drop in consumer spending is a decline in gaming spend. Gaming spend, which represents 66% of all app store spend, is down 5% year-on-year (YoY).

And it’s very likely that this decline in discretionary gaming spend is caused by a reduction in consumers’ disposable incomes. As you can see in this chart, which overlays OECD data on disposable household income and consumer spend on game in the US, the curves very closely match each other. A similar curve is seen in other (but not all) regions.

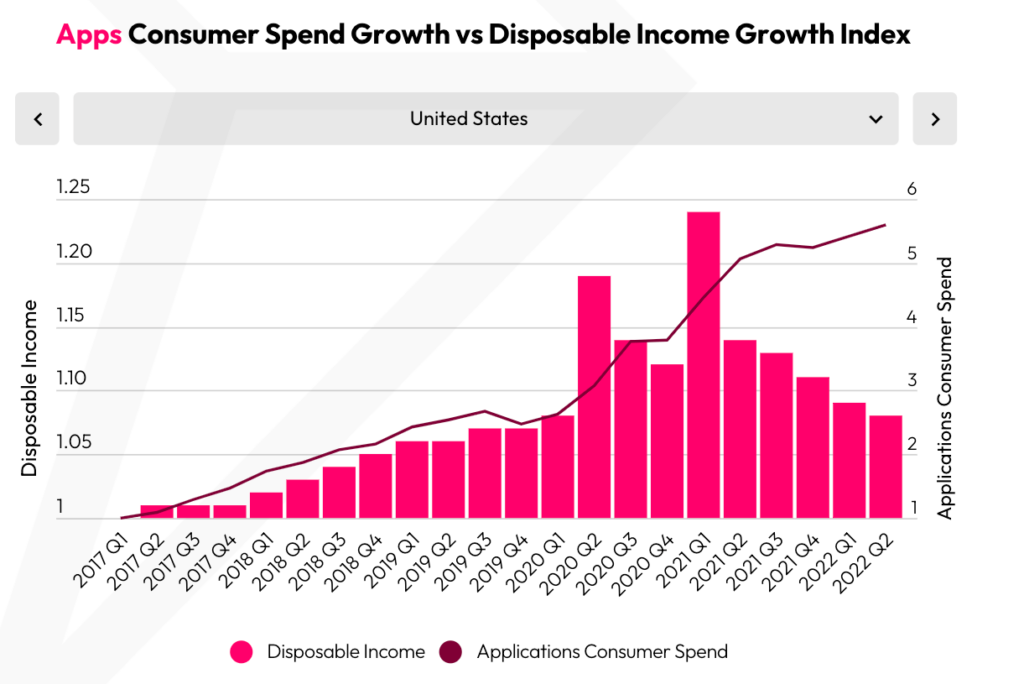
But if we look at the same OECD data overlaid on consumer spending in apps, rather than games, we see the opposite: disposable income drops while app spend goes up.

Spending in apps is largely driven by subscriptions so clearly, this monetization model is displaying much greater resilience. This is because consumers see their subscriptions in a similar light to their cable bills. Those streaming service subscriptions (entertainment is the dominant category in apps) are more like “need-to-have” services, in contrast to game in-app purchases, which could be seen as more frivolous.
The biggest opportunities might lie beyond saturated markets
If the first takeaway is that subscriptions are more resilient because they represent a committed spend on something a consumer considers “essential”, the second is that certain countries have seen especially high growth.
Let’s look at the top 20 countries for non-gaming spend, including their YoY growth:
- US $18.2B (+16%)
- China $14.8B (-9%)
- Japan $4.7B (-4%)
- UK $1.8B (+2%)
- Germany $1.2B (+7%)
- Canada $1.1B (+11%)
- Australia $1B (+16%)
- South Korea $1B (+21%)
- France $0.9B (+6%)
- Brazil $0.7B (+31%)
- Saudi Arabia $0.7B (-4%)
- Taiwan Market $0.5B (+11%)
- Italy $0.4B (+10%)
- Thailand $0.4B (+11%)
- Spain $0.4B (+9%)
- Mexico $0.4B (+26%)
- Switzerland $0.3B (+16%)
- Netherlands $0.3B (+16%)
- Norway $0.3B (+22%)
- Sweden $0.3B (+14%)
First of all, the US has seen 16% YoY growth. Clearly, for those of you already with subscription apps serving the US, that’s great news. But beyond native English-speaking countries, we see countries like Brazil (+31%), Mexico (+26%), Norway (+22%), South Korea (+21%) growing substantially.
That’s huge.
What this means is that more app makers should be looking for opportunities beyond their primary market. And those who do so earlier have a greater chance of establishing themselves before the market becomes saturated.
Before we wrap up, let’s take a look at the biggest categories in the top five countries for growth:
| Country | Top three categories (% revenue share) |
|---|---|
| Brazil | Entertainment (15%), Productivity (9%), Photo & Video (6.5%) |
| Mexico | Entertainment (14.9%), Photo & Video (6.6%), Social (4.7%) |
| Norway | Entertainment (18.3%), Lifestyle (10%), Photo & Video (5.8%) |
| South Korea | Entertainment (4.9%), Social (3.6%), Photo & Video (2.1%) |
| United States | Entertainment (10.7%), Lifestyle (5%), Photo & Video (4.9%) |
What we see are commonalities across all countries, with Entertainment dominant in all.
What we would recommend to readers looking to localize is to explore their app’s category in a tool like data.ai to see a segmented view of high-growth countries.
For instance, if we look just at Medical apps, Norway jumps from 19th place for non-gaming spend to 6th place — with a YoY growth of 195%.
Your next steps to test the waters of localization
- Use an app store analytics tool, such as data.ai or Apptopia, to explore your app’s category in different regions. Has your category jumped in growth in some regions more than others?
- Use advertising to test demand in different locations before going through the whole app localization process. Bear in mind, you’ll probably want to localize your app store listing as part of this process (not only will this help conversion, but Apple Search Ads creates ads using the metadata you’ve specified for a locale).
- Once you’ve decided that you’re ready to take the full plunge in a particular location, consider using tools to easily translate your entire app, such as Localazy or Lokalise.
- Run price testing. What works best in terms of price point, promotions, and duration will differ per geographic region. Learn more about A/B price testing and make the process easy with RevenueCat Experiments.
Who will be first to capitalize on this “golden age of app store growth?
We know that app localization isn’t a trivial exercise. And nor is every app at a growth stage where localization is likely to be the best use of resources (such as those still yet to establish a product-market fit). These are subjects we will explore in future blogs.
But this data makes a very clear case for both the subscription model, which proves to be more resilient in the face of tightening consumer spend, and for localizing into high-growth markets.
The question is: who will get their first?
In-App Subscriptions Made Easy
See why thousands of the world's tops apps use RevenueCat to power in-app purchases, analyze subscription data, and grow revenue on iOS, Android, and the web.


