How to Calculate Recurring Revenue
More app developers are considering how to incorporate recurring revenue into their applications.

Andy Boedo
More app developers are considering how to incorporate recurring revenue into their applications. This comes as Apple has incentivized subscriptions by lowering their fees after one year of subscription renewals and adding support for introductory pricing. Before leaping into a recurring revenue stream, it’s important to have some intuition about how revenue works for an app with subscriptions.
A Standard Revenue Model
For normal, one-time purchases, revenue can be modeled as the following:

Revenue equation for an app with one-time purchases.
Downloads is the number of new users downloading your app. Conversion rate is the probability that a user buys your in-app purchase, ranging from 0.0 (no purchases), to 1.0 (everyone purchases). The average price is the price paid on average for a purchase.
One thing to know about this model is that the conversion rate depends on the price. The conversion rate is roughly inversely related to the price: if the price decreases, the conversion rate will improve. The relationship follows a sort of demand curve. The conversion rate can be improved without changing the price. This can be done by doing things like adding new features, improving the app experience, or changing the placement of the point of purchase.
A Recurring Revenue Model
The recurring revenue looks somewhat similar to the one-time model, with the addition of revenue coming from renewals. And, by the way, RevenueCat calculates this for you out-of-the-box.

The recurring revenue model adds a non-linear term dependent on the churn rate.
The revenue for a month equates to all the new business from said month plus revenue from previous months. Recurring revenue from previous months is reduced from its original level because some proportion of subscribed users will stop renewing their subscriptions, churning out. This proportion is called the churn rate.
The churn rate (CR) is the proportion of users who unsubscribe every month. Churn can become a powerful lever in boosting revenue because monthly revenue grows exponentially as the churn rate approaches zero. However, a typical value for churn rate is anywhere from .15 to .50 but depends heavily on the nature of the subscription.
Thanks nerd, but what does it all mean!?
Unfortunately, non-linear functions with co-dependent parameters aren’t so easy to think about. Sometimes the best way to understand a complex equation is just to see it in action.
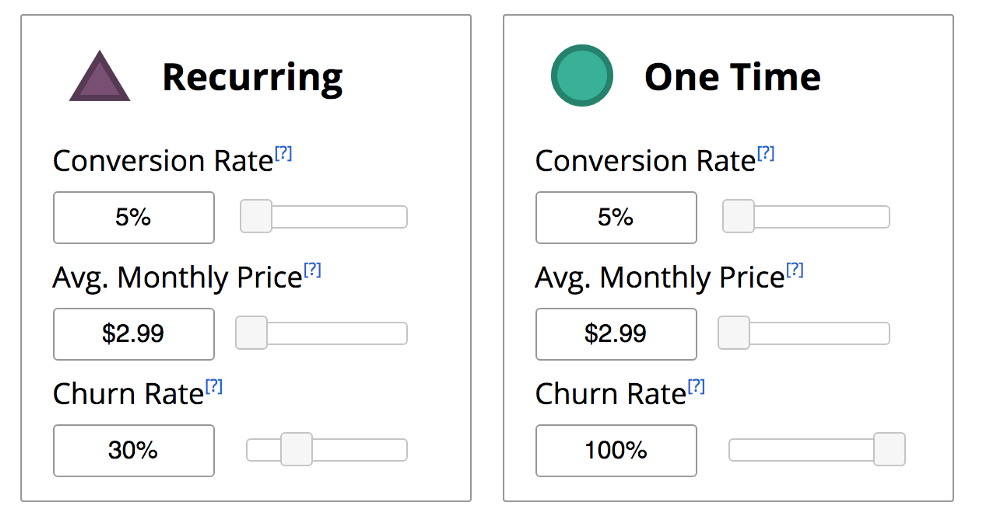
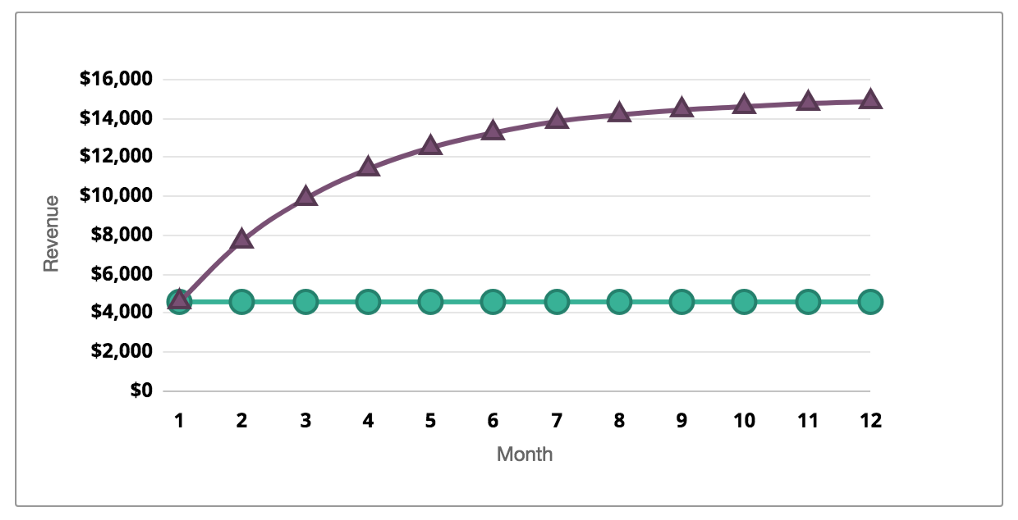
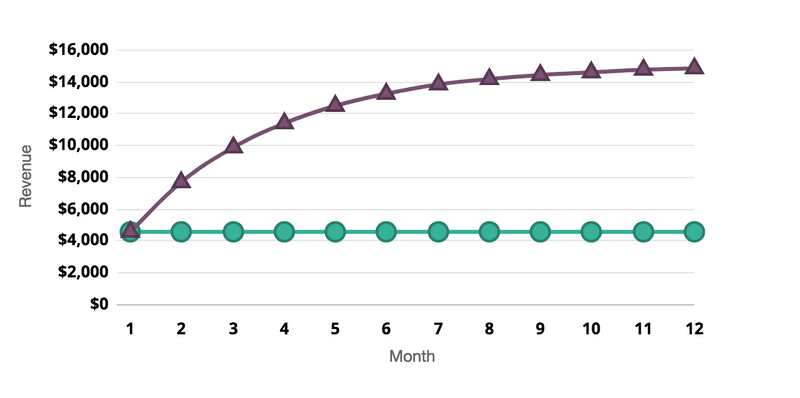
Playing with the different combinations of conversion rate, monthly price, and churn rate, you will hopefully gain an intuition for the dynamics of a recurring revenue model. You can also check out the examples below to see some different scenarios.
Other Examples
One-Time Expensive vs. Recurring Cheap
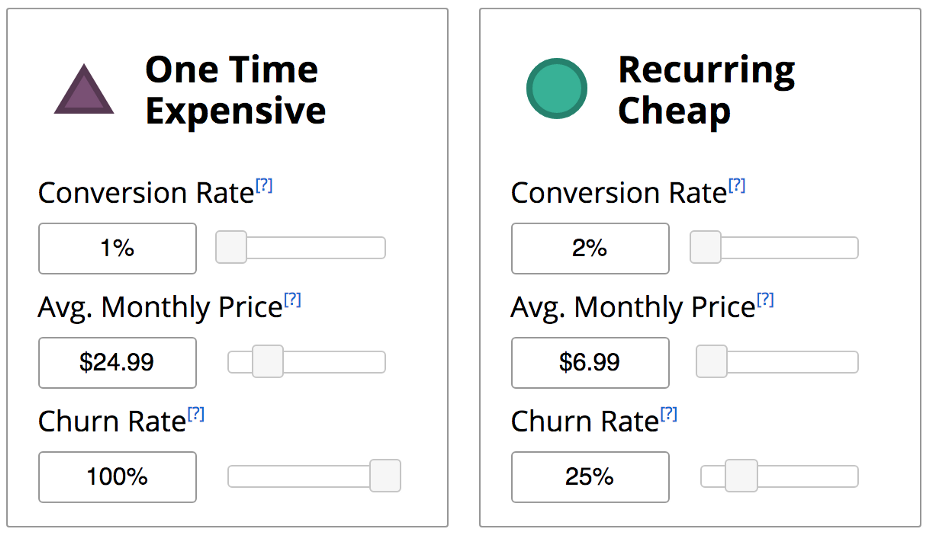
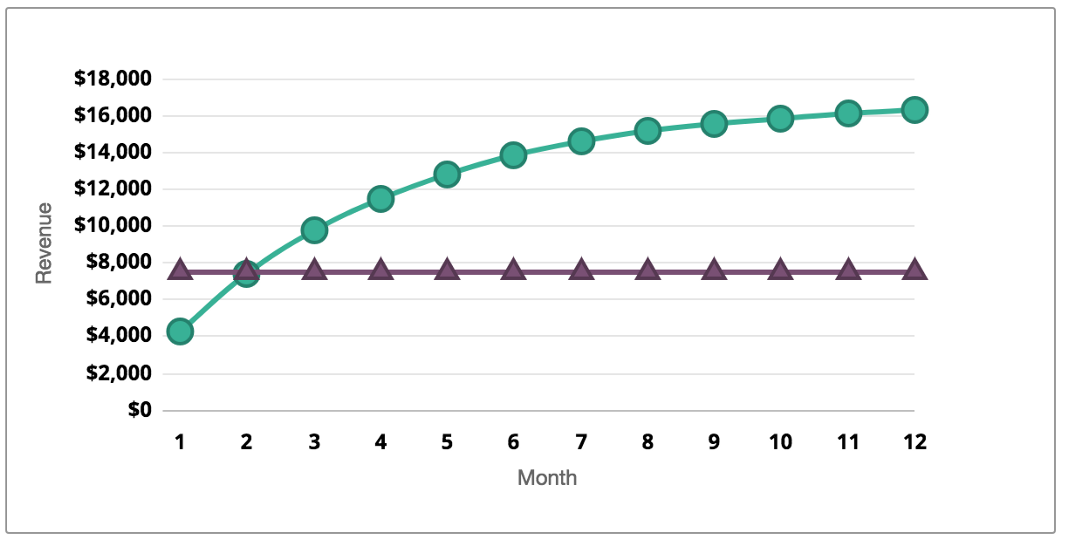
One Time Expensive: A user pays a higher price once
Recurring Cheap: A cheaper, recurring subscription
Recurring Expensive vs. Recurring Cheap
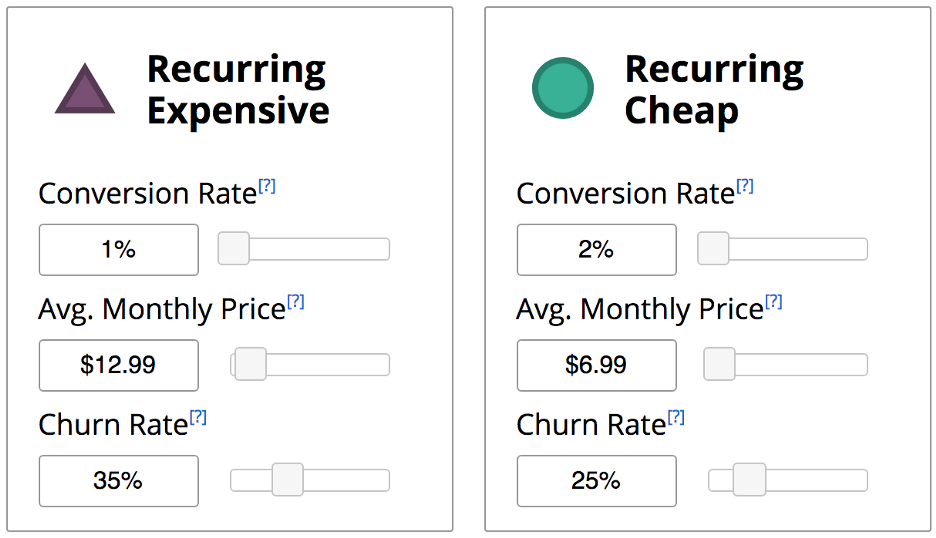
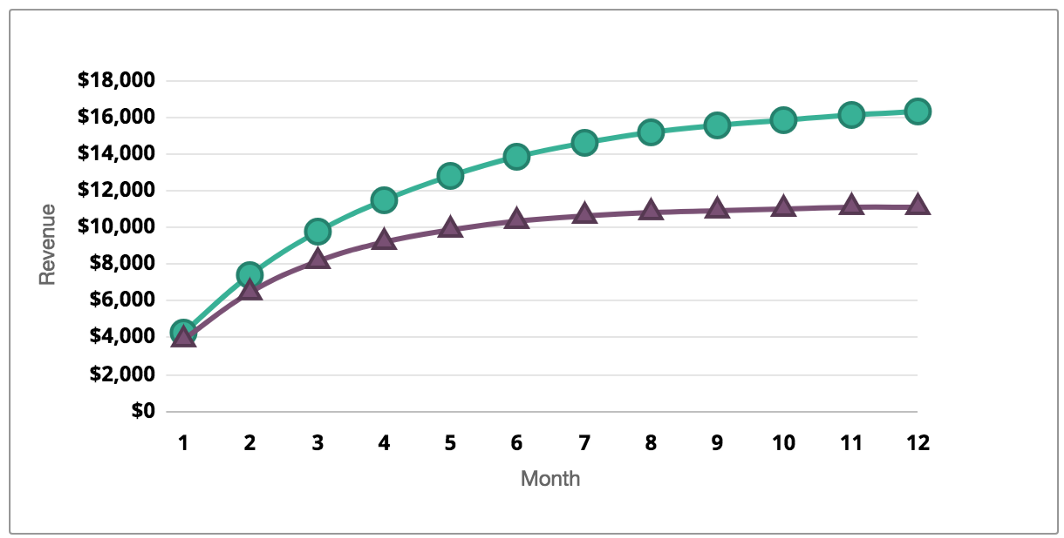
Recurring Expensive: A user pays a higher price recurring, lower conversion Recurring Cheap: A cheaper, recurring subscription, higher conversion, lower churn
High Churn vs. Low Churn
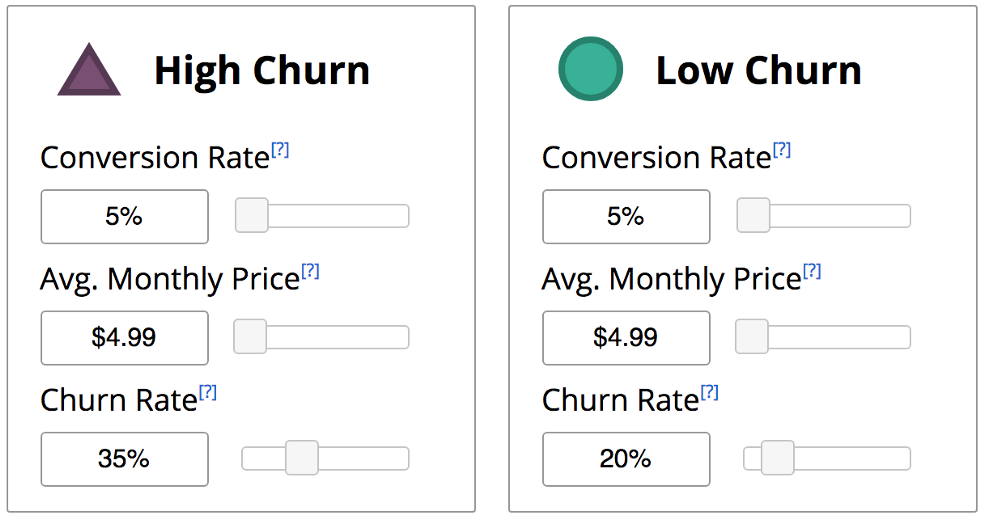
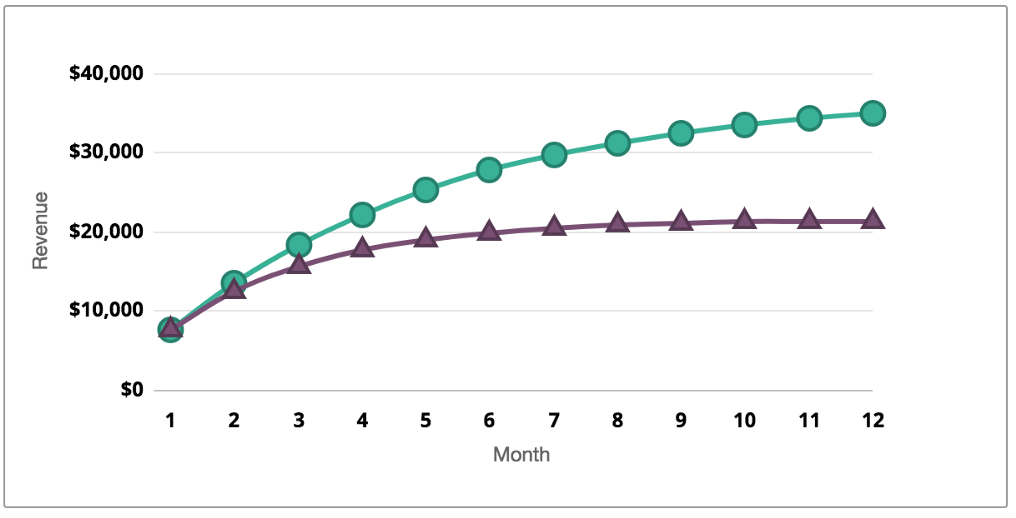
High Churn: A relatively high churn rate Low Churn: A relatively low churn rate
In-App Subscriptions Made Easy
See why thousands of the world's tops apps use RevenueCat to power in-app purchases, analyze subscription data, and grow revenue on iOS, Android, and the web.


